
Move quickly with confidence.
Get more from AI tooling, protect the quality of your codebase, and support your team – it’s all possible when you have the right insights.

The easier way to do continuous improvement
Get insights
See insights like what work is blocked, who's not getting enough feedback, and what AI risks are emerging.


Diagnose
We scan your data to surface what’s driving trends. Then we give you discussion questions to learn more from your team.


Take action

Once you’ve diagnosed the issue, create a plan – set a target to reach and explore our recommended experiments to get there. Then take action!

Track progress
Our notifications help you stay on top of progress. We’ll help you re-adjust if an action isn’t working and remind you to celebrate when you’re successful.


Then back to “Get insights” to keep improving!
One place to see all your team’s data
We make it easy to get insights from your data. We connect with the tools you already use so that you can get more from the data you already have.
Version control systems
Connect to our GitHub app to see insights based on your team’s PRs, commits, reviews, and comments.
.png)
GitHub
Coming soon: BitBucket, GitLab
CI/CD tooling
Track the reliability and speed of deployments with our GitHub Actions integration or Deployments API.

GitHub Actions,
.png)
Deployments API
Issue tracking
Integrate with the issue tracking tools like Linear and Jira to see insights on where your team’s time went and potential blockers.

Linear,
Jira
Incident management
Track reliability with metrics like Mean Time to Restore (MTTR) and out-of-hour pages using one of our IMS integrations.

PagerDuty,

Opsgenie
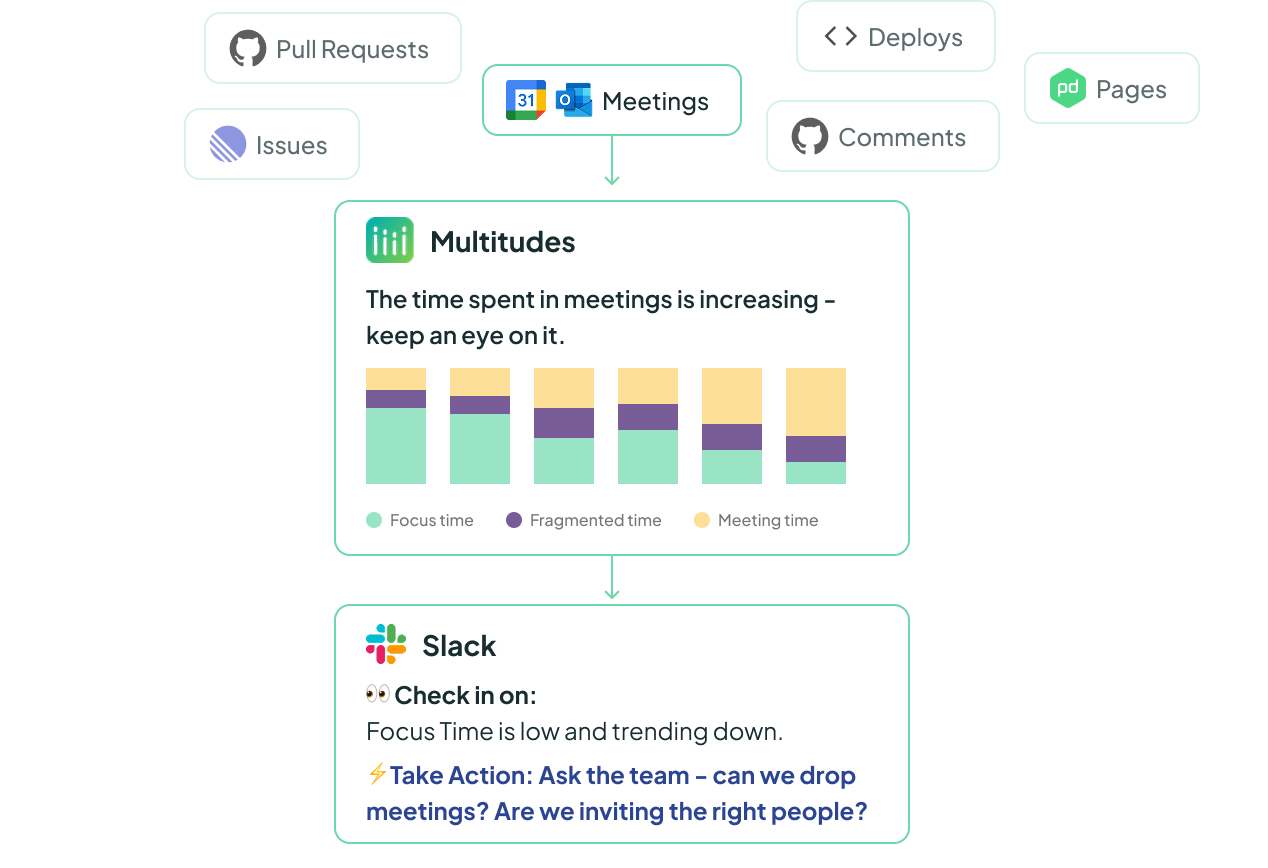
Meetings
Protect focus time and track meeting load, including out-of-hours meetings.

Google Calendar,

Outlook Calendar
AI tooling
Set up Slack alerts to get insights and recommended actions in your workflow.
Claude,
GitHub Copilot,
Cursor
Notifications
Set up Slack alerts to get insights and recommended actions in your workflow.

Slack
Thoughtful data you can trust.
Grounded in best-practice data principles, we’re intentional about how we collect and analyze data. We know that transparency builds trust, so we have detailed, public docs and provide data drill-downs for every chart. We’ve responded to the black box of LLMs with more transparency too, about how we build and evaluate our AI features.

We collaborate with world-leading academics to conduct our own research.

Every new feature must adhere to our data ethics principles.
.png)
We show the same metrics to leaders and devs, and we’ll never stack-rank developers.
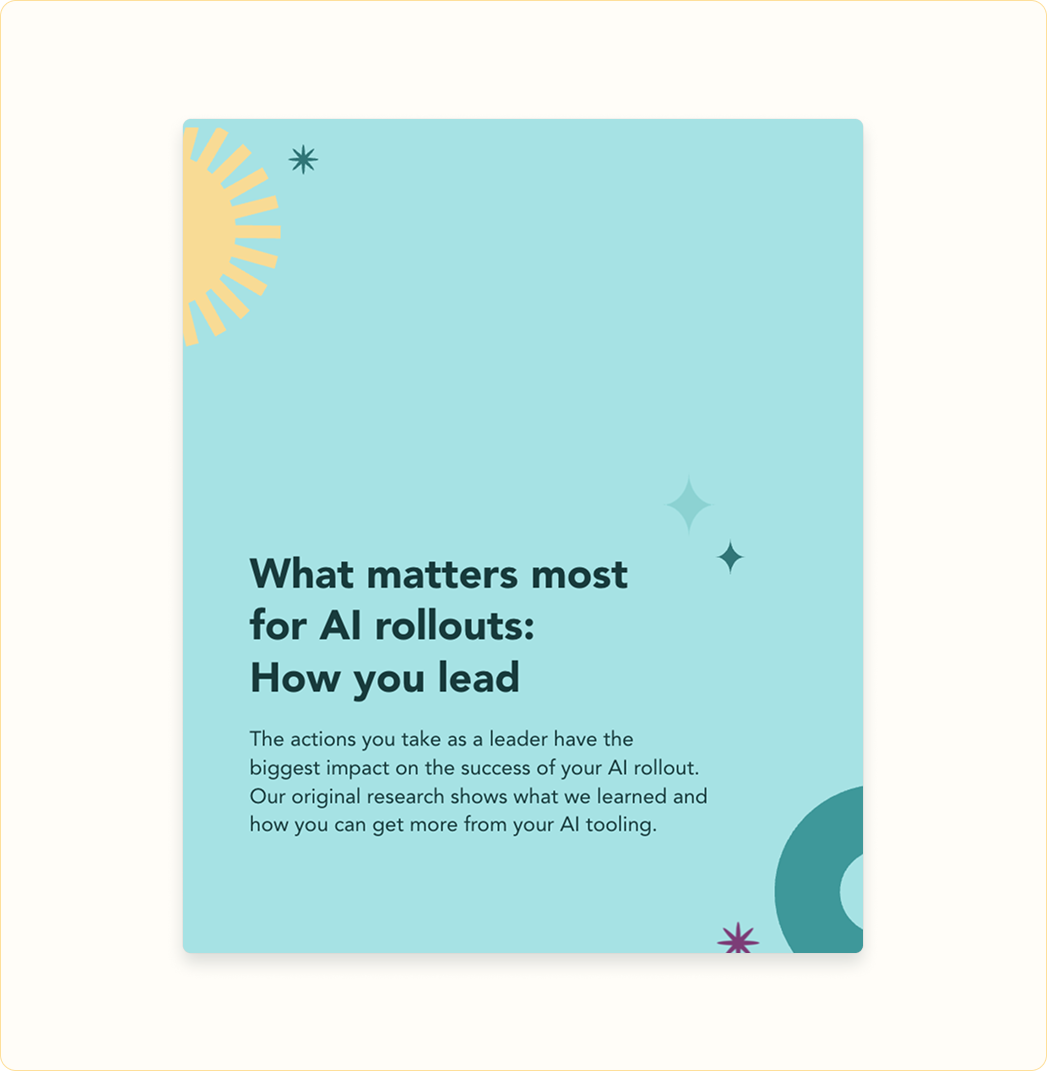
Data to cut through the hype: Our AI impact research
Our research findings show what matters for increasing adoption, how AI impacts not only productivity but also hours worked, and what the best teams do differently to protect codebase quality while rolling out AI. For more, check out our whitepaper.
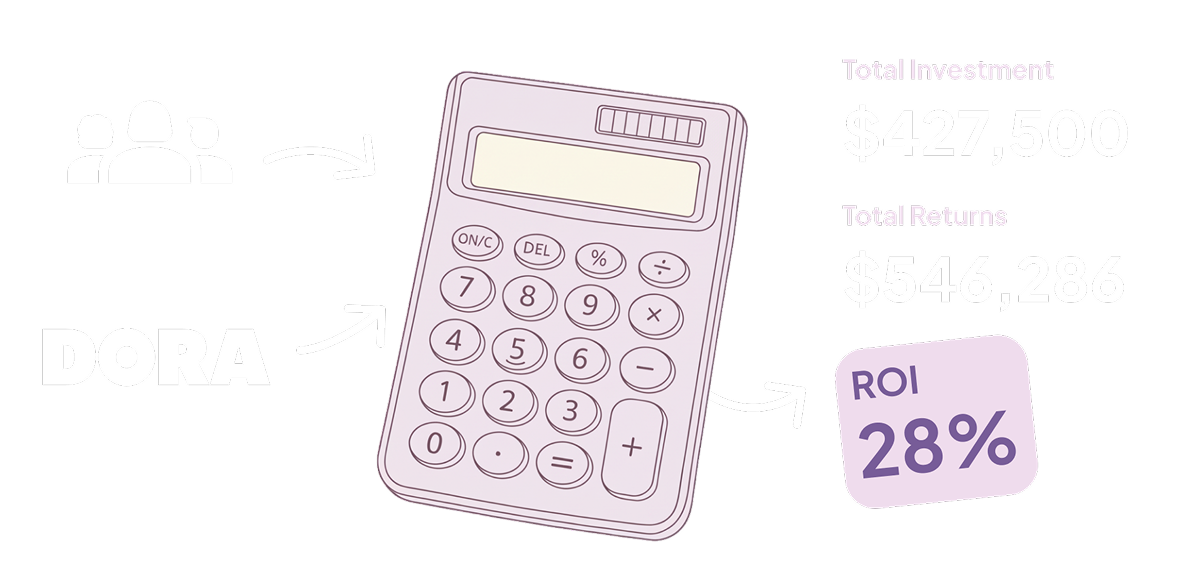
What’s the ROI of your AI tooling?
Which metrics do we measure and why?
We use metrics from the tools you already use to make it easy to get insights and act on them. Measuring a combination of DORA, SPACE, and DevEx metrics, you can slice your team’s data to suit your needs – because what matters most is not the framework but how you take action on it.
See how we measure
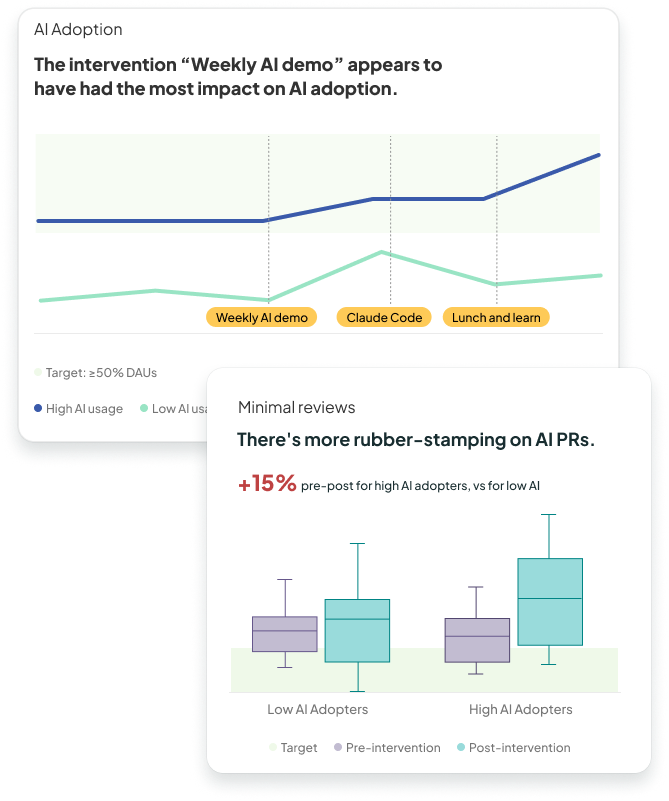
AI Impact
Our AI impact research showed that how you support your people to use AI matters more than the AI tooling you buy. With the right culture and insights, engineering leaders are achieving productivity gains, minimizing AI slop, and motivating their whole team to use AI tooling.
For more on our approach, view our AI Impact page.
DORA metrics
DORA is a 10-year longitudinal research program that shows which software delivery metrics are linked to organizational performance and individual wellbeing (learn more about DORA and developer productivity). The Multitudes app has the four key DORA metrics – see them at a glance on the DORA page or dive deep in our detail pages.
Change Lead Time: The time it takes a code change to go from first commit to successfully running in production. This shows how well the work is flowing through.
Deployment Frequency:How often code is deployed to production or released to end users. This gives an indication of how much value is being delivered to customers.
Change Failure Rate: The percentage of changes to production that caused failures, requiring remediation like hotfixes or rollbacks. This gives an indicator of the quality of our change processes.
Mean Time to Recovery (MTTR) & Failed Deployment Recovery Time (FDRT): How quickly an organization recovers from a production failure. Note that DORA has now replaced MTTR with Failed Deployment Recovery Time (FDRT), which is the time it takes to restore service after a change to production results in degraded service.

SPACE metrics
SPACE is a framework developed by Nicole Forsgren (co-author of DORA), Margaret Anne-Storey, and other researchers at Microsoft (learn more here). The framework takes a big-picture view of developer productivity across 5 key dimensions, and recommends that any measurement should pull from at least 3 of these buckets:
Satisfaction and Wellbeing: How fulfilled, happy, and healthy developers are.
Multitudes provides behavioral indicators to show when you might need to check in on this, with metrics including: Out-of-hours Work, Page Disruptions , and Meeting Load.
Performance: An outcome of a system or process.
Measure this in Multitudes with metrics like: Change Failure Rate, Mean Time to Restore (MTTR), Mean Time to Acknowledge (MTTA), and Review Wait Time
Activity: The count of actions or outputs completed while working.
Measure this in Multitudes with metrics including: Deployment Frequency, Merge Frequency, Types of Work, Feature vs Maintenance, Coding Time, and Feedback Given.
Collaboration: How people and teams communicate and work together.
Measure this in Multitudes with metrics like: Participation Gap (the range of comments, from least to most), Feedback Given, Feedback Received, Feedback Flows, Review Wait Time, and Editing Time
Efficiency and flow: The ability to do work with minimal delays or interruptions.
Measure this in Multitudes with metrics like: Change Lead Time and subsets, Deployment Frequency, Focus Time, Page Disruptions, and Meeting Load
Note that depending on how you use the metric, the same metric could sit under multiple dimensions.
DevEX metrics
The DevEx framework recommends improving developer productivity by looking at developer experience (DevEx). It groups DexEx into 3 dimensions: Feedback Loops, Flow State, and Cognitive Load. Multitudes provides a range of metrics that align to the DevEx framework.
Feedback Loops
- This is the speed and quality of responses to actions performed. The goal is to shorten these.
- Measure this in Multitudes with metrics including: Change Lead Time, Review Wait Time, Editing Time, and Deployment Time.
Cognitive Load
- This encompasses the amount of mental processing required for a developer to perform a task. The goal here is to reduce it, so that it stays low.
- Measure this in Multitudes with metrics like: Deployment Failure Rate (which helps spot if teams are carrying the cognitive burden of frequently failing deployments) or with quality metrics like MTTR, MTTA, Change Failure Rate, and Page Disruptions (these can help you spot if your team is carrying extra cognitive load from managing incidents). And if PR Size is high, that can indicate that the cognitive load of reviews is high.
Flow State
- This is a mental state in which a person is fully immersed in their activity, with focus, involvement, and enjoyment. The goal is to increase this.
- Multitudes can show you what’s interrupting flow state with metrics like: Page Disruptions, Meeting Load, and Types of Work and Feature vs Maintenance (which can show if teams are getting pulled into more bug/support work). Focus Time shows you how much time your team is getting for deep work. Finally, our Blocked PRs alerts helps you get people back into the flow, by showing to when people are blocked and waiting for reviews.

Process metrics

Flow of Work
It’s frustrating for everyone when work gets blocked. That’s why we look at how the work is flowing with Change Lead Time.
This measures the time it takes to go from first commit until the commit has been deployed to production. It is one of the four key indicators of software team performance, as per Google’s DORA research. This is closely related to Cycle Time.
To help you find bottlenecks, we break down your Change Lead Time into its subsets: Coding Time, Review Wait Time, Editing Time, and Deploy Time.
We also look at other metrics that can impact the Flow of Work, like PR Size (since smaller PRs move through faster) and your team’s Focus Time (since it’s hard to move work forward without focus time).


Value Delivery
Bluntly speaking, coding work doesn’t have an impact until it’s deployed to customers. To get an indicator of this, we look at Deployment Frequency, the number of successful deployments that a team made to the production environment. This is another one of Google's four key DORA metrics. We also look at Merge Frequency, which can be useful for teams on fixed deployment schedules.
In addition to how much was shipped and how often, we also care about what kind of work we did. To show that, we measure Types of Work and Feature vs Maintenance Work. These insights are based on issue tracking and commits data.


Quality of Work
To make sure we’re not sacrificing quality for speed, we look at two other DORA metrics: Change Failure Rate and Mean Time to Recovery (MTTR). Note that from 2023 DORA has replaced MTTR with Failed Deployment Recovery Time.
Change Failure Rate is the percentage of deployments that cause a failure in production. We also show Deployment Failure Rate, the percentage of attempts to deploy to production that failed (or timed out).
Mean Time to Recovery is a measure of how quickly an organization recovers from a production failure, and Mean Time to Acknowledge shows how quickly an incident is acknowledged. And if you’re trying to get a handle on noisy pages, or want to know which services or escalation policies have the most pages, check out our Number of Pages analysis.
To see the human impact of pages, check out our Wellbeing section.

People metrics

Collaboration
Good collaboration is the backbone of good code. Extensive research shows that code reviews support code quality, knowledge-sharing, and learning. How people participate in reviews can also be an indicator of psychological safety on teams (more in Google’s team dynamics research).
To help teams understand their collaboration patterns, Multitudes looks at metrics like the Participation Gap (which shows the gap between those who do the most and least code reviews), Feedback Given (in code reviews), Feedback Received, and Feedback Flows (which shows who gives feedback to whom).
We also look at Feedback Quality. This shows the overall quality of feedback given in code reviews to help you create more inclusive review processes and Feedback Themes to surface insights about common topics that appear in your team's code reviews.


Wellbeing
Research shows that 71% of tech workers are burned out.
That's why we look at Out-of-Hours Work, which shows how often people are working outside their preferred working hours – this looks across on-call pages, commits, and meetings. Collectively, these can be a warning sign of potential burnout.
Our Wellbeing metrics also show Page Disruptions and Meeting Load within work hours too. Research shows that more meeting interruptions at work leads to people working overtime and feeling more drained.

Here’s how our customers use Multitudes for continuous improvement.

“Multitudes has become my go-to for identifying any blockers that might have arisen. By regularly checking in on the data, I can make more informed decisions over time.”
89%
decrease in Change Lead Time
1 year
of steadily decreasing <code-text>Change Lead Time<code-text> – and counting!


It was great to have real-time data to compare and see trends over time. In particular, it helped us to be able to do a deep dive into AI – it meant we could do the rollout quickly, knowing we would have leading indicators of AI’s impact, which gives us time to adjust as needed.
8.5%
decrease in PR size
161%
increase in Merge Frequency
.svg)
“A clear view of the types of work we’re doing helps us balance features with tech debt, bugs, and support — and have more informed conversations about how we’re contributing to the full product pie.”
93%
reduction in build pipeline time.
2x
velocity, while 3x'ing the number of tech debt tickets completed.


“Alongside the holistic view of team health, this simple insight tells the whole story.”
20
Pull Requests per month maintained
5%
increase in learning time


“Having collaboration data has had a positive effect on review practices at Octane. Using Multitudes makes me feel more comfortable in experimenting – it takes the guesswork out of it.”
48%
decrease in <code-text>Change Lead Time<code-text> (7-week rolling average median)
50%
increase in <code-text>Feedback Given<code-text> (7-week rolling average median)
Get your questions answered

Research
Peer-reviewed original research on developer productivity, using data to take action, and more.
View our research
→

Docs
Find answers to your questions about Multitudes, our product or what we measure and why.
View our docs
→

Community
Find answers to your questions about Multitudes, our product or what we measure and why.
View our Community
→
Uncover insights to take action today.
Get useful insights on team performance and culture, along with updates on our product!
© Copyright 2026 Multitudes Limited. All rights reserved.

.svg)
.svg)
.svg)